claude-telemetry
Claude Code Usage Tracking
Multi-PC aggregation dashboard for Claude Code power users
Multi-PC Aggregation
Auto-sync agent on each machine pushes usage data to a central Supabase database. See total spending across all your workstations.
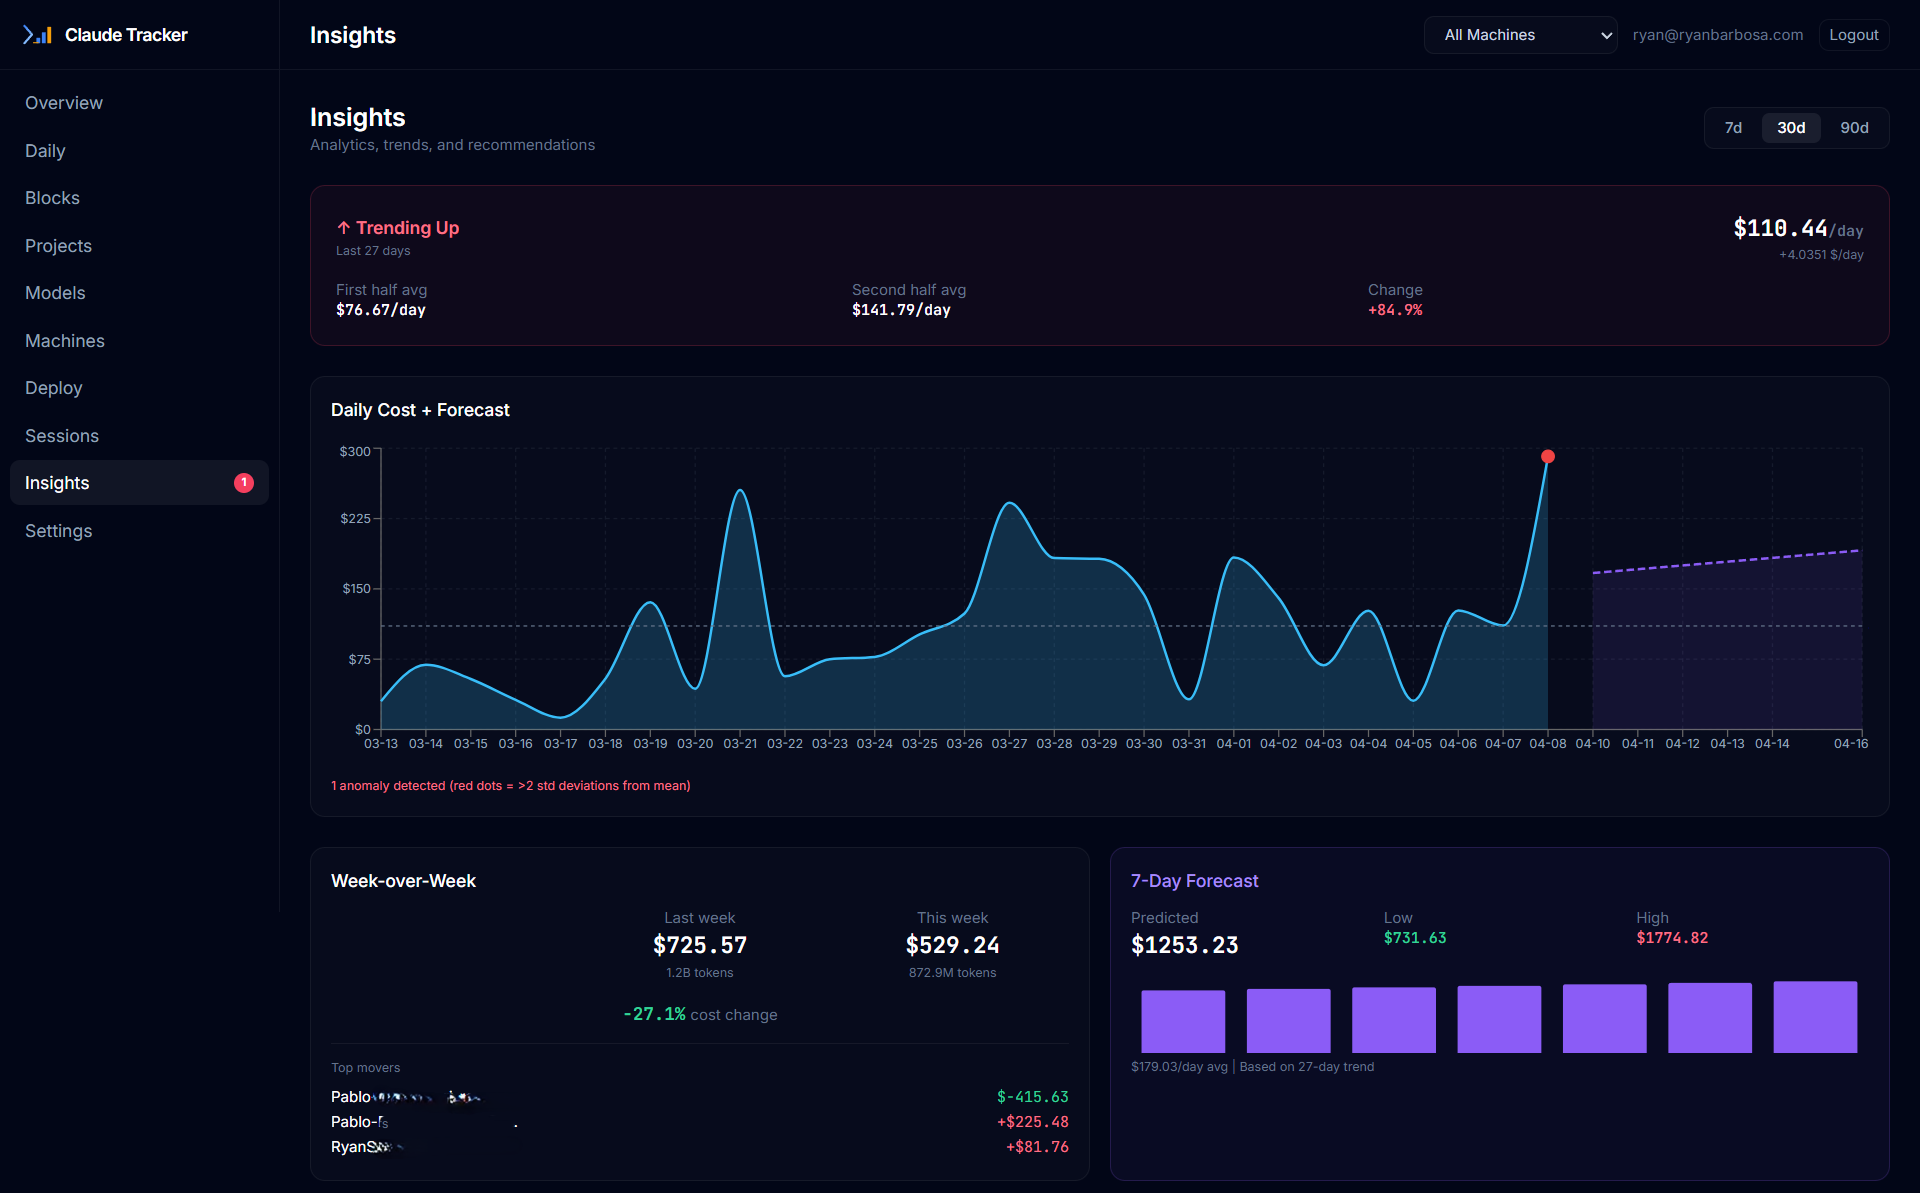
Web Dashboard
Dark-mode React dashboard with interactive charts. Filter by machine, project, model, and time period.
Real-time Hooks
Data syncs the moment your session ends via Claude Code hooks. Sub-100ms execution, zero blocking. Polling daemon as 60-min backup.
Zero Exposed Keys
Cloudflare Workers proxy all API calls. No secrets in your frontend bundle. Magic link auth with email whitelist.
MCP Server
12 tools for natural language queries. Ask Claude about your usage, trends, anomalies, and forecasts directly.
Smart Analytics
Insights Engine with trend detection, anomaly alerts, 7-day forecasts, and week-over-week comparisons.
The Problem
CLI tools like ccusage and ccost are excellent for tracking Claude Code usage — but they're single-machine tools.
If you use Claude Code on 2+ PCs (work laptop, home desktop, cloud VM), you have no unified view of your total spending. The Anthropic rate limits are per account, not per machine — you need to see everything together.
- No idea how close you are to your 5-hour block limit across machines
- No way to compare daily spend between workstations
- No centralized dashboard to share with your team or manager
- No historical trends across your entire usage footprint
The Solution
claude-telemetry is the aggregation and visualization layer on top of tools like ccusage.

Each PC runs a lightweight Python agent that calls ccusage to extract usage data from Claude Code's logs and syncs it to Supabase every 15 minutes. The agent does no custom JSONL parsing — it delegates that to ccusage and focuses only on multi-PC aggregation and centralized sync.
Quick Start
Get up and running in 3 steps:
1. Setup Supabase (free tier)
Create a project on supabase.com and run the SQL migrations:
-- Run in Supabase SQL Editor
-- Full schema: /guide/installation
CREATE TABLE IF NOT EXISTS usage_data (
  id UUID DEFAULT gen_random_uuid() PRIMARY KEY,
  machine_id TEXT NOT NULL,
  timestamp TIMESTAMPTZ NOT NULL DEFAULT NOW(),
  -- ... see full migration in installation guide
);
2. Deploy the Dashboard
git clone https://github.com/RyanTech00/claude-telemetry.git
cd claude-telemetry/dashboard
npm install
npx wrangler pages project create claude-telemetry
npx wrangler pages secret put SUPABASE_URL        # paste Project URL
npx wrangler pages secret put SUPABASE_SERVICE_KEY # paste service_role key
npx wrangler pages secret put ALLOWED_EMAILS       # e.g. "you@email.com"
npm run build
npx wrangler pages deploy dist
3. Install the Agent on Each PC
npm install -g ccusage ccost
pip install cc-telemetry
cc-telemetry setup    # interactive wizard
cc-telemetry doctor   # verify everything works
The setup wizard configures hooks, MCP server, statusline, and daemon automatically. See the full installation guide for details.
Comparison
| Feature | claude-telemetry | ccusage | ccost | CC_Dashboard |
|---|---|---|---|---|
| Daily/Monthly/Session reports | ✅ | ✅ | ✅ | ✅ |
| 5-Hour Blocks | ✅ | ✅ | ✅ | ❌ |
| Weekly reports | ✅ | ✅ | ❌ | ❌ |
| Web dashboard | ✅ | ❌ | ❌ | ✅ |
| Multi-PC aggregation | ✅ | ❌ | ❌ | ❌ |
| Auto-sync daemon | ✅ | ❌ | ❌ | ❌ |
| Deploy page (Wazuh-style) | ✅ | ❌ | ❌ | ❌ |
| Auth + email whitelist | ✅ | ❌ | ❌ | ❌ (API key) |
| Plan vs API cost | ✅ | ❌ | ❌ | ✅ |
| Currency conversion | ❌ | ❌ | ❌ | ✅ |
| Docker support | ❌ | ❌ | ❌ | ✅ |
| Rate limit predictor | ✅ | ❌ | ❌ | ❌ |
| Project budgets | ✅ | ❌ | ❌ | ❌ |
| Cross-machine burn rate | ✅ | ❌ | ❌ | ❌ |
| MCP Server (12 tools) | ✅ | ✅ | ❌ | ❌ |
| Real-time hooks | ✅ | ❌ | ❌ | ❌ |
| Insights Engine | ✅ | ❌ | ❌ | ❌ |
| Webhook alerts | ✅ | ❌ | ❌ | ❌ |
| Rate limit % (5h/1w) | ✅ | ❌ | ✅ | ❌ |
| Zero cost hosting | ✅ | N/A | N/A | ❌ |
| Open source | ✅ MIT | ✅ MIT | ✅ MIT | ✅ MIT |
claude-telemetry uses ccusage and ccost as data layers. We're the aggregation and visualization layer on top.
What Shipped in v0.3.0
- ✅ Real-time Hooks — Sub-100ms data sync via SessionEnd + Stop hooks
- ✅ MCP Server — 12 tools for natural language usage queries
- ✅ Insights Engine — Trends, anomalies, forecasts, week-over-week in the dashboard
- ✅ Webhook Alerts — Discord/Slack notifications for budgets and rate limits
- ✅ Unified Setup — Interactive wizard with dependency checks
- ✅ cc-telemetry doctor — 10-point health check command
- ✅ PyPI Publishing — pip install cc-telemetry, no git clone needed
See the full Roadmap for v0.4.0 and beyond.
Support
If claude-telemetry saved you from rate limit blindness or helped you understand your Claude Code costs, consider supporting the project:

Star the repo on GitHub to help others discover claude-telemetry.